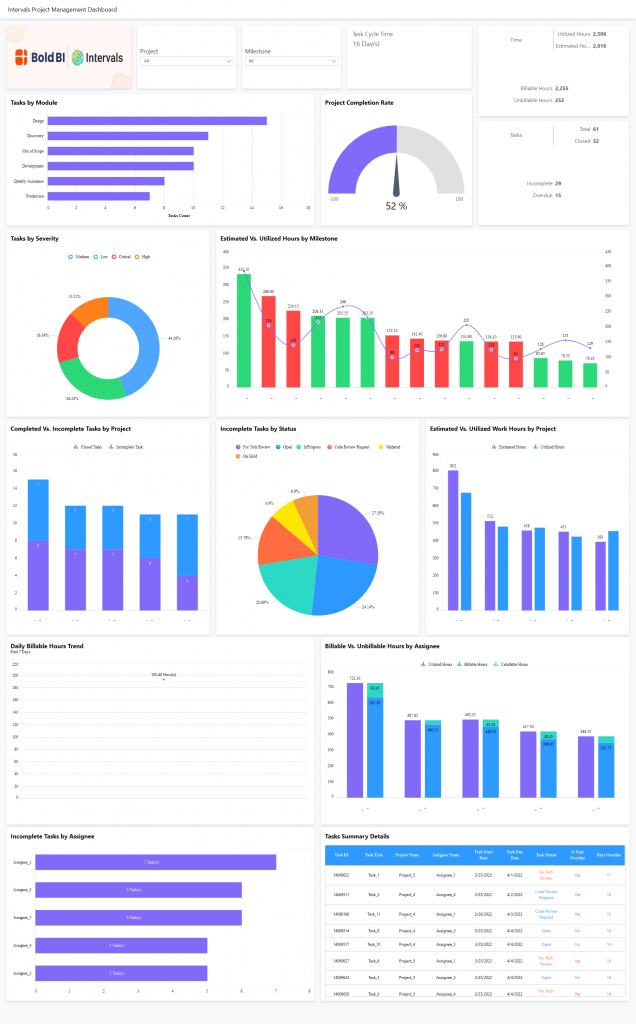
For those currently using (or considering) Intervals for their project management, take a look at these visual dashboards from Bold BI. The dashboard’s creators have tapped into our project management API to build a monitoring service that provides a complete overview of your team’s workflows and key metrics.
Use these dashboards to monitor key metrics that are central to analyzing and understanding business intelligence — including task cycles, employee productivity, billable hours, workload balance, and overall project progress. The collection of widgets available on the Bold BI dashboards provide detailed insights into every aspect of a project. The dashboards also include filters for breaking down overall team performance by project and milestone.
