Every web developer has had the unfortunate experience of their code going rogue and wreaking havoc on a server. An error in the code chewed up all the RAM. An ill-planned query maxed out the CPU and disk I/O, pushing load up too high. The server squawks and we have to do something to fix it.
To resolve these spikes in real-time, and often times in production, the web developer has to go into dev ops mode, becoming half developer, half system administrator. The Linux utility Htop makes it much easier for the web developer to put on the sysadmin hat and troubleshoot a server’s woes.
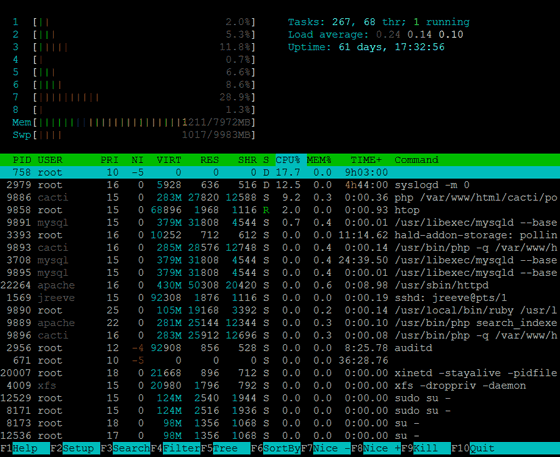
Htop provides a colorized view of CPU, RAM, swap, load, and a list of all running processes, making it very useful for troubleshooting problems like memory leaks. Htop also provides tools to search, filter, and sort processes, and kill any one of them.
Here are just a few ways in which Htop can be essential in DevOps:
- Sort on the MEM% column to see which processes are using up the most memory.
- Sort on the CPU% column to see which processes are using up the most CPU
- Press F9 to send a SIGTERM to the currently selected process and kill it
- Monitor load and CPU in real time
- See how long a process has been running using the TIME+ column
Htop puts all of the system resources and processes on one screen, giving a budding system administrator an easy to understand overview of the server, and the tools to troubleshoot poor performance. Htop should be in every web developer’s toolbox.