Every monday morning we pile into Michael’s Volkswagen Vanagon and head across town to the Beachbreak Cafe for our weekly meeting. After a round of coffee and chilaquiles, we get down to business.
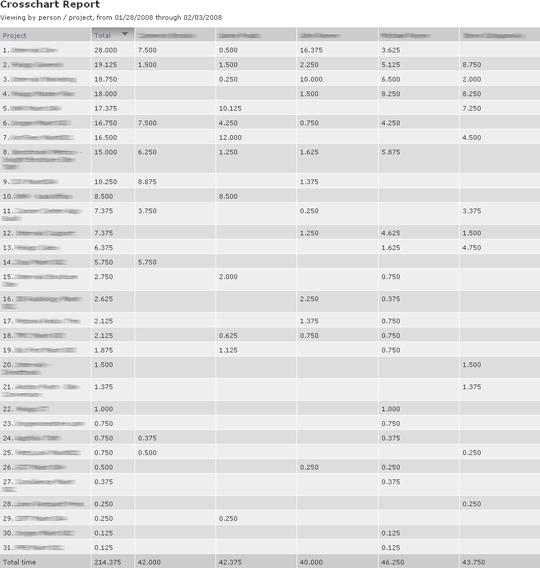
The first thing we do as a team is evaluate the previous week using the Intervals Crosschart report. The axis can be set to any combination of project, worktype, person, module, or client. For our meeting we run the Crosschart report by person and project, so we can quantify how much of each persons time is going to each project. Sorted by total time tracked, we can see which projects took up most of our time, and which projects took up too little.
Reviewing the Crosschart report each monday morning informs our week. It tells us which projects need to be better cared for, and which projects we may need to jettison. Using the screenshot below, our conversation would have brought up the following points to address this week:
- Let’s make sure we’ve invoiced projects 1 through 9; we’ve done a considerable amount of work for them recently.
- Someone should followup with projects 10 through 14; they are tapering off in hours and may need to be closed out
- What are we going to do about projects 15 through 31?; they are taking up so little of our time, let’s be sure we aren’t overcommitted
