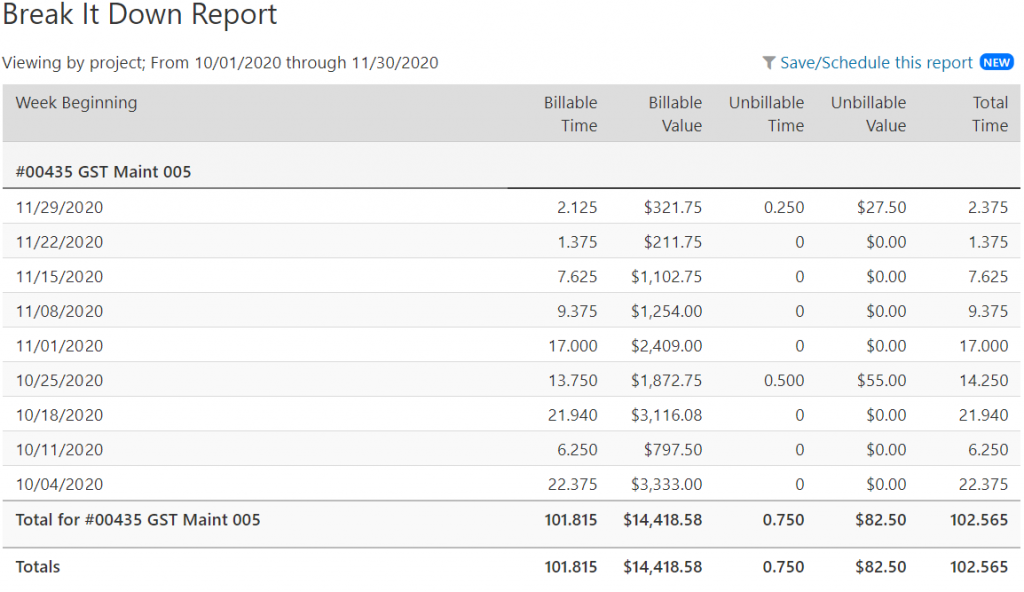
We’ve been receiving questions from customers centered around the need for a high level overview of the financial value of work performed, grouped by project or person, and broken down by weeks or months. After several customer interviews we decided to improve the Break it Down report to meet this need. And we’re happy to announce that we recently launched a new and improved report.

In addition to showing billable and unbillable hours, it now includes the financial value of those hours. When combined with daily, weekly, and monthly views, and the ability to group by project, person, and more, this report may just become one of our most popular.
The Break it Down report is applicable in several different scenarios where this high level reporting is needed. For example, you may have several clients that are paying you a monthly retainer. Run this report in weekly mode, grouped by project, to show how much billable work was performed each week on each of your retainer projects.
You may also have a client with a project scheduled to take several months. Run this report in monthly mode, grouped by module, to see how the project work is adding up over time so you can keep a close eye on the overall budget. The number of ways this report can be run, and the use cases it addresses, are limitless.
→ Read the help article for more information on using this report.


