UPDATE:
The Periscope report has been overhauled and renamed as the Gantt Chart. Here is our blog post introducing this new feature:
Announcing the Intervals Gantt Chart

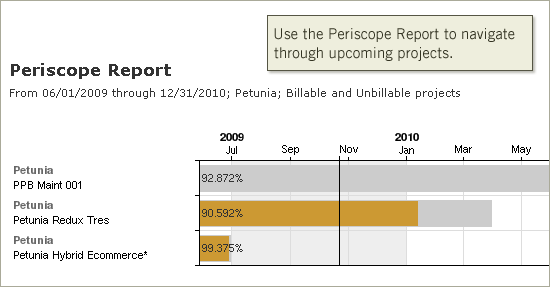
Intervals has focused most of its features on tracking time, task and project data for making informed decisions on how to best plan and manage upcoming projects. To help make this process more complete we’ve added the Periscope Report. This new Gantt-like chart gives project managers a view of their projects along a timeline. Find out when projects are beginning and ending, and how far along each project has progressed. The timeline view empowers project managers to schedule projects according to how they will impact overall workflow.
We are considering this report to be in beta because we’ve only scratched the surface on the wealth of information that will be available in upcoming updates. We will be increasing the report’s Ganttiness by adding more detailed milestone and task information for each project.
The Periscope Report can be accessed by logging into your Intervals account and clicking on the Reports tab. You can continue from this page to the report or run one of the popular reporting options from the list.


